Exporting Plot Data and Plots
MegunoLink has two options for exporting data from plots:
- as an image of the plot, or
- as the data values that are plotted.
In each case the exported image or data can be saved to a file or copied to the clipboard.
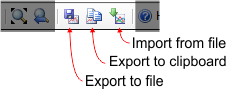
To save plot data or an image to a file, click the Save Chart Data (![]() ) button and select a suitable file format and location. Choose comma separated values (*.csv) or tab separated values (*.txt) to export numerical series data to the file that you can subsequently load into Microsoft Excel or Matlab for further analysis. Choose one of the image formats (bitmap (*.bmp), PNG, TIf, Jpeg, etc) to export an picture of the graph. You can also use MegunoLink’s scheduled reporting tool to save an image of the graph periodically — every few minutes, hours, or whenever you select Send reports now from the reporting menu.
) button and select a suitable file format and location. Choose comma separated values (*.csv) or tab separated values (*.txt) to export numerical series data to the file that you can subsequently load into Microsoft Excel or Matlab for further analysis. Choose one of the image formats (bitmap (*.bmp), PNG, TIf, Jpeg, etc) to export an picture of the graph. You can also use MegunoLink’s scheduled reporting tool to save an image of the graph periodically — every few minutes, hours, or whenever you select Send reports now from the reporting menu.
To copy the plot data to the clipboard, select Copy chart data from the Copy data dropdown (![]() ). MegunoLink places comma separated data on the clipboard that you can paste into Microsoft Excel (see below).
). MegunoLink places comma separated data on the clipboard that you can paste into Microsoft Excel (see below).
To copy image of the plot to the clipboard, select Copy chart image from the Copy data dropdown (![]() ). An image of the plot, as it appears in MegunoLink, is placed on the clipboard for you to paste into another application.
). An image of the plot, as it appears in MegunoLink, is placed on the clipboard for you to paste into another application.

Export plot data or images to a file or the system clipboard.
Opening Exported Data in Microsoft Excel
You may find Microsoft Excel doesn’t show the date and time correctly when opening CSV files that you’ve exported from MegunoLink. You might see a number or just part of the time.

Dates and times imported into Microsoft Excel may be shown as numbers (the internal representation for time) or partial times.
To format the time for an imported CSV file:
- Select the column you want to format. Include all the time values, but not the heading. If you click in the top cell then press Ctrl + Shift + Down Arrow on your keyboard, all the values will be selected.
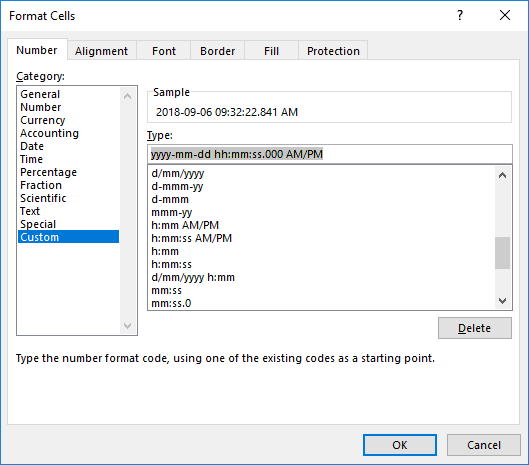
- Either select More number formats… from the Number Format drop-down on the Home tab of Excel’s menu ribbon, or right-click on the selected cells and choose Format Cells.... This will show the Format Cells dialog box.
- Select the Custom category and enter the format you’d like to use in the Type field. For example,
yyyy-mm-dd hh:mm:ss.000 AM/PMwill show the full date, including 3 decimal places for the seconds. - Click OK to apply the format.
Apply a date format to cells to display values imported from a time-plot correctly.
Excel adds your format to the list of custom formats in the Format Cells dialog. So if you can select the format from the list in the Format Cells dialog for a second or third range. You don’t need to type the format string each time.
You can use these format types to customize the way date and time are displayed:
HH:MM:SS.000: show time, without date, using a 24-hour clock instead of AM/PM. 3 digits are shown after the decimal point for secondshh:mm:ss.000 AM/PM: show time, without date, using a 12-hour clock including the AM/PM marker. 3 digits are shown after the decimal point for secondsdd-mm-yyyy: show date, without time, with the day first (European format)mm-dd-yyyy: show date, without time, with the month first (US format)yyyy-mm-dd HH:MM:SS.000: international format for date and time using 24-hour clock
Pasting Data
If you decide to copy and paste the data into Excel you will need to tell excel to convert the pasted text to columns. In the picture below you can see its just pasted the comma separated (CSV) data in as text.

What you need to do is select all of your data in column A, click on the data tab and select “Text to Columns”. This will open up a dialog.

From the dialog select “Delimited” and click “Next”.

Make sure “Comma” is ticked and confirm that the data in the preview looks correct. Once you are happy click “Finish”. Like the CSV file, the dates will also appear as a large number. See the section above on how to convert them to a useful date and time format.

Importing Data
Use the Import command to load data which you have exported from MegunoLink back into a plot. You’ll find the import command on the Time- and XY-plot visualizers toolbars. You will be prompted for the file to import then MegunoLink will load the data into the plot.
Click the Import file button to load exported data into a plot
If your plot already contains a series with the same name as one of the imported series, data will be appended to the existing series.
It may be possible to import files that were not exported from MegunoLink if they are in the correct format:
- The first line of the file must contain the series names separated by two commas.
- The rest of the file is pairs of comma separated values to import.
- The first value of the pair is used for the x-value; the second for the y-value.
- Any missing or invalid values are ignored.

